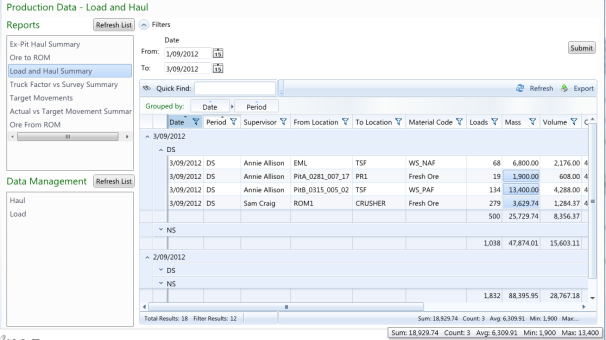
In the above report example the results from the Load and Haul Summary query have been displayed for the selected date range in a data grid. The report has been grouped by Period within Date, with additional filtering on the Date column.
The Totals row at the bottom of the data grid displays the number of records extracted, the number of filtered records and sum, count, average, minimum and maximum values for the highlighted mass values.
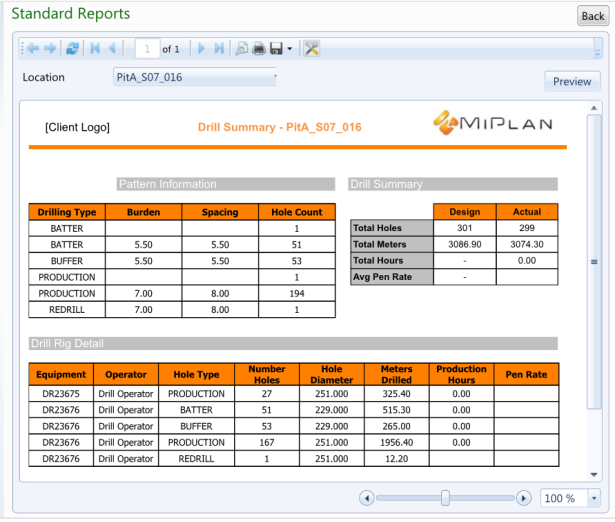
In the above example the pattern information, drill summary and drill rig details are displayed for PitA_S07_016.
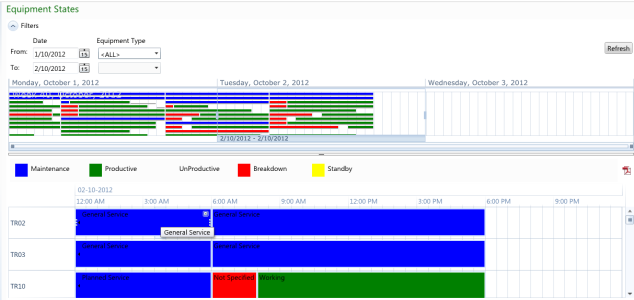
In the example report above the equipment states for the selected period are displayed as an interactive time line.
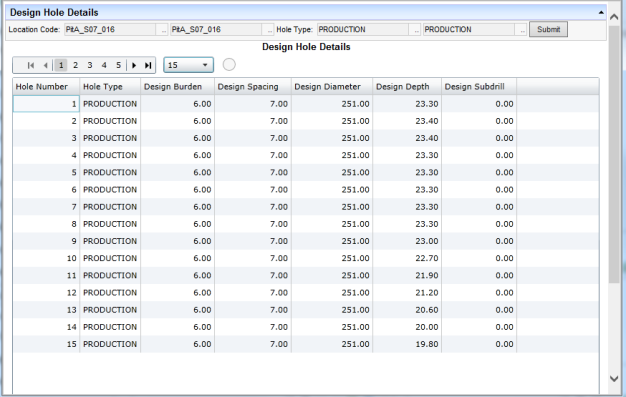
In the above report example the Design Hole Detials are published for the selected location code and hole type.
Note: The report is displayed as a Silverlight table.